How Often Should You Clean Solar Panels?
Dust on a solar panel rarely looks dramatic from the ground. A thin grey film, a few bird droppings, maybe a stripe of pollen after spring — easy to ignore. The measured output tells a different story. Field studies by the U.S. National Renewable Energy Laboratory (NREL) put average soiling losses in the United States at roughly 5% per year, and that average hides a huge spread: 1–2% in rainy temperate regions, but 5–25% in arid regions where panels go months without a proper rinse. Knowing how often to clean — and when cleaning stops paying for itself — comes down to a handful of measurable factors.
What Soiling Actually Costs You
Soiling loss is usually quoted as a daily accumulation rate. Monitoring stations across the U.S. record typical rates of 0.03–0.15% per day, which sounds trivial until it compounds. In desert environments, field studies including Sandia National Laboratories’ long-running work (Kimber et al.) have measured rates around 0.5% per day during dry spells. Left uncleaned for a month, that is 6–20% of your energy — gone, every month, for as long as the dry season lasts.
Three things drive how fast your site accumulates loss:
Airborne particle load. Desert sand, highway dust, industrial particulates and agricultural pollen each behave differently. Mineral-rich desert dust bonds to glass more stubbornly than loose pollen.
Tilt angle. Steep arrays shed dirt with every heavy rain. Modules mounted near-flat (under 10°) form standing puddles that dry into mud rings — one of the worst soiling patterns observed.
Rainfall pattern. Frequent heavy showers act as free cleaning. Light drizzle does not — it can actually cement dust into a thin crust.
How Often to Clean, by Environment
There is no universal schedule, but the ranges below match what most field studies and O&M operators converge on:
| Site condition | Typical loss if uncleaned | Suggested frequency |
|---|---|---|
| Desert / high dust (MENA, Southwest US, outback) | 0.3–0.8% per day; 15–20%+ per month | Every 1–3 months |
| Near-flat tilt (<10°) in a dry climate | Rapid, with permanent mud rings | Every 4–8 weeks |
| Industrial areas / near heavy traffic | Faster adhesion, oily films | Quarterly |
| Farmland (pollen, spray drift, bird activity) | Seasonal spikes | 2–3 times per year, timed to seasons |
| Temperate, rainy, tilt >15° | 1–2% per year | Once a year, plus spot checks |
Treat these as starting points. Inverter-level data beats any table: if your performance ratio dips 3–4 points below its weather-corrected baseline, the panels are telling you it is time, whatever the calendar says.
Is Rain Enough?
Partly — and it is worth being honest about where the free cleaning ends. In high-rainfall, steep-tilt installations, rain genuinely does most of the work on loose dust; that is why annual losses in places like the UK or the Pacific Northwest stay under 1–2%.
But rain has three blind spots:
Bird droppings. They do not dissolve and wash off easily. Worse than the visible spot is the electrical effect: a dropping shading one cell can drag down a whole string, and sustained local shading is a hot-spot risk.
Cemented dust. Light rain followed by sun bakes a mud film onto the glass. Once hardened, it survives the next ten showers.
Flat arrays. Low-tilt panels in dry regions simply never get rinsed hard enough to self-clean.
What the Cleaning-Frequency Data Says
NREL’s soiling work includes a useful modeling result on frequency. For a site with moderate soiling (around 1.9% average annual loss when never cleaned):
| Cleaning schedule | Average annual soiling loss |
|---|---|
| Never | ~1.9% |
| 1 cleaning per year | ~1.5% |
| 2 cleanings per year | ~1.3% |
| 3 cleanings per year | ~1.2% |
Read the honest takeaway from that table: the first cleaning captures most of the value, the second adds a bit, the third is marginal. For most moderate sites, one or two well-timed cleanings a year — ideally after the dry season and just before your highest-irradiance months — recover the large majority of recoverable energy. Chasing the last 0.1% with monthly cleaning only makes sense where electricity prices are high and irradiance is strong.
The reverse is also true, and worth saying plainly: a small rooftop system in a cheap-power market may not justify paying for frequent professional cleaning at all. Monitor, spot-clean droppings, and schedule one annual wash. The economics of cleaning are local — run your own numbers before committing to a schedule.
Why Drone Cleaning Fits Frequent Schedules
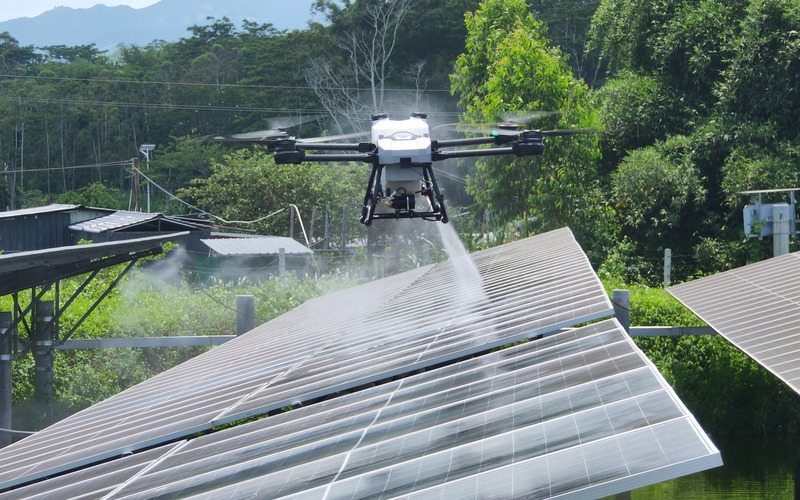
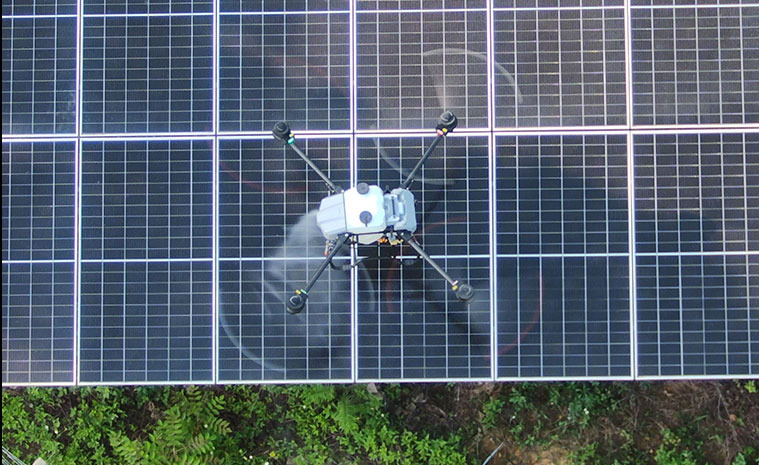
For sites that do need quarterly or monthly cycles — desert plants, near-flat utility arrays, dusty industrial roofs — the bottleneck is usually labor and logistics: walking crews on rooftops, lift equipment, safety measures, and thousands of panels per day. This is where a solar panel cleaning module for the DJI FC100 platform changes the math.
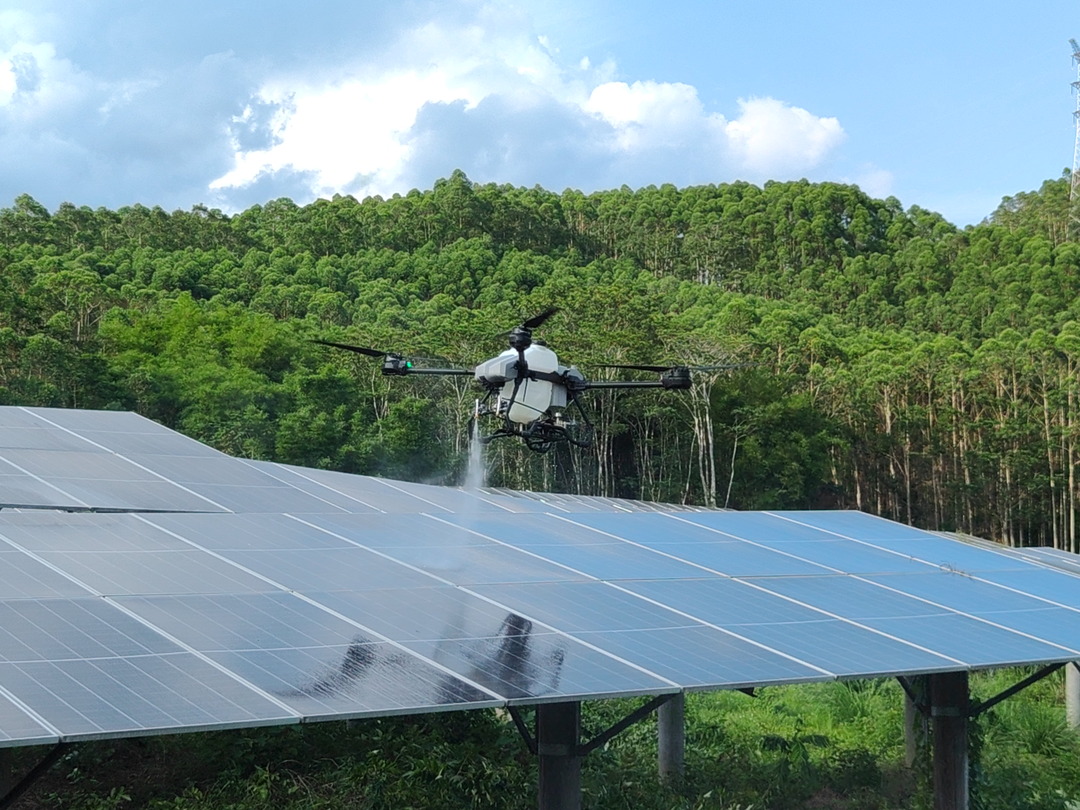
The module mounts to the aircraft and carries its own water supply — around 80 liters per trip — with a dual-pump system (10–15 MPa, adjustable) feeding a three-nozzle spray head with 0°/15°/25°/40° angle options and a 5–65° swing range. Flow rate adjusts electrically between 5 and 20 L/min, so the operator can match the spray to the dirt level instead of soaking the modules. No one walks on the glass, so there is no foot-traffic microcracking risk, and no rooftop fall exposure. At full-load weight under 8 kg (excluding the tank), the module keeps the aircraft nimble across large arrays.
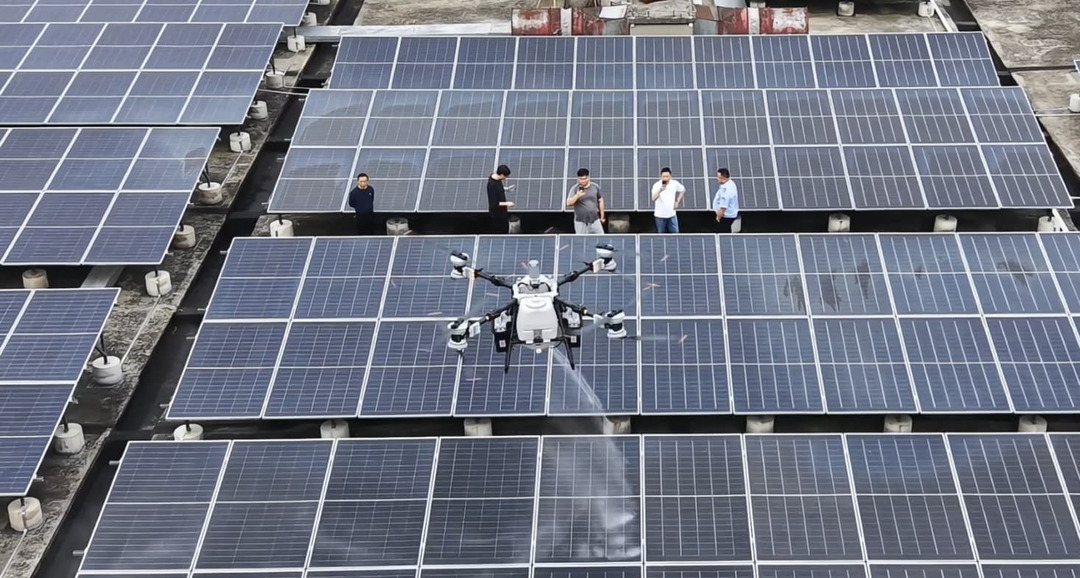
Frequency also becomes easier to justify when each cleaning session is cheaper. If you are weighing how a drone setup would fit your own plant, our drone solar panel cleaning configuration guide walks through the equipment choices, and our solar panel cleaning solution page covers full deployment scenarios.
A Simple Action Plan
1. Baseline it. Pull twelve months of inverter data and weather-correct it. Your soiling loss is the sawtooth pattern between rain events.
2. Pick a frequency from the table — then adjust after your first two cleanings against real output recovery.
3. Time it. Clean after the dry season and before peak generation months; that is when each liter of water buys the most kilowatt-hours.
4. Spot-clean droppings fast. They are small in area but disproportionate in electrical damage.
5. Log before/after output for every session. The recovery percentage tells you whether your current frequency is right — or more than you need.
If you are planning a cleaning program for a utility-scale site or building a cleaning service business in a high-soiling region, tell us your array size, location and water access — contact us and we will help you size the right setup.